October 15th, 2026
Dental Data Breaches by State: Where HHS Reports Come From
Industry Research — Dental Cybersecurity, DSO
Every state has dental offices. Not every state has a dental breach on the federal breach list.
At Medix Dental IT, we counted dental data breaches by state on the HHS Office for Civil Rights breach portal, from the list’s start in 2009 through September 30, 2026, and compared each state’s count with how many dental offices it has. In nine states, we couldn’t identify a single report from a dental practice, dental group or dental school in that whole time: Delaware, Kansas, Kentucky, Nebraska, New Hampshire, South Dakota, Vermont, West Virginia and Wyoming. Oregon and Minnesota have the highest rates for their number of dental offices, about 3 and 2.7 times the national rate. The list records where dental breaches were reported. It can’t tell you where they happened.
Read the zeros with one fact in mind. HHS’s public list only covers breaches of 500 or more people, and for 2024 HHS counted more than 100 smaller breaches across healthcare for every one big enough to make it. The spread between states is also wider than office counts alone would predict, but no single state’s difference holds up once you allow for testing 51 jurisdictions.
| What we counted | Finding |
|---|---|
| Dental provider incidents on the HHS list (practices, dental groups, dental schools) | 239 incidents, from 260 reports |
| National rate | 1.76 recorded incidents per 1,000 dental offices over the full period |
| States with no dental provider report | 9: Delaware, Kansas, Kentucky, Nebraska, New Hampshire, South Dakota, Vermont, West Virginia, Wyoming |
| Highest rates per 1,000 offices | Oregon (10 incidents, 5.2 per 1,000 offices) and Minnesota (9, 4.8) |
| Largest shortfalls from expected | California (25 incidents against about 40 expected) and Illinois (4 against about 10) |
| Is the spread between states more than chance? | If reports followed office counts, a spread this uneven would turn up about 1 time in 100. No single state’s difference holds up after adjusting for testing 51 jurisdictions. |
Nine states with no dental breach report on the HHS list
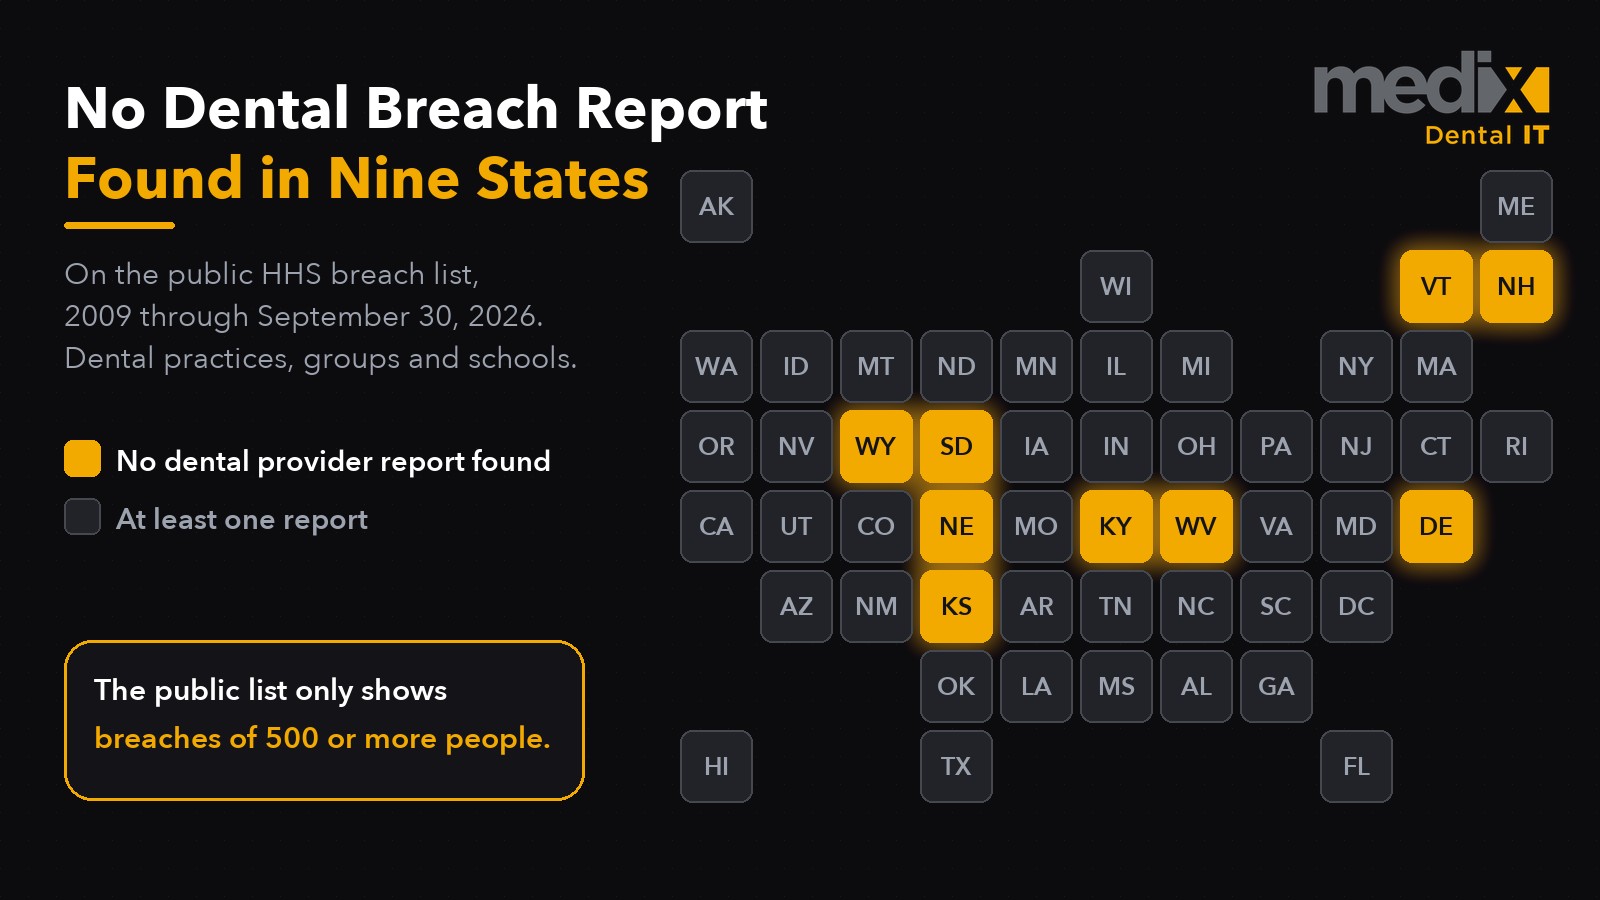
In Delaware, Kansas, Kentucky, Nebraska, New Hampshire, South Dakota, Vermont, West Virginia and Wyoming, we found no dental practice, dental group or dental school on the HHS list from 2009 through September 2026. Because a zero is the easiest number to get wrong, we checked them by hand. We read all 439 reports filed from those states and looked up every filer whose type wasn’t clear from its name or OCR’s description, in the federal NPI registry or on the web. We found no dental-only provider. Two filers we still couldn’t place, and neither shows any sign of dental work. Community health centers that offer dental care alongside medical care appear in every one of these states. We left those mixed centers out everywhere in this study, because their reports don’t show whether dental records were involved.
Three things could explain a zero, and public records can’t tell them apart. The first is the 500-person line.
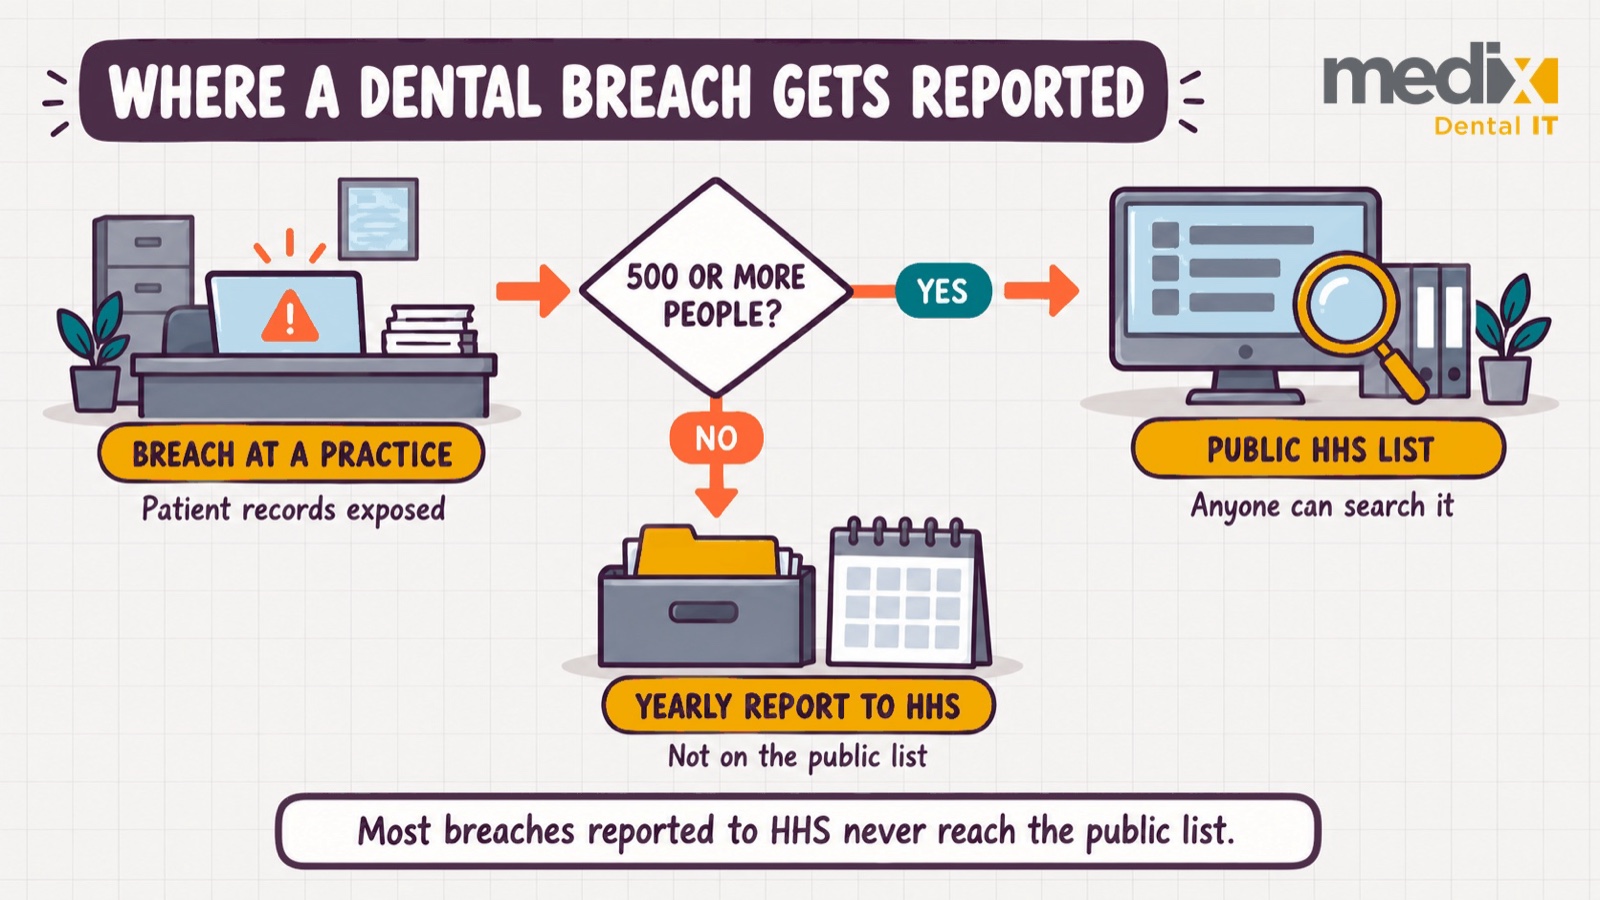
The gap is large. In its latest annual report to Congress, HHS counted 663 breaches of 500 or more people that occurred or ended in 2024, across all of healthcare, and 74,299 smaller breaches that occurred that year. That’s more than 100 small breaches for every one big enough for the public list. HHS doesn’t publish a dental-only count of the small ones.
The second is chance. At the national rate of 1.76 incidents per 1,000 dental offices, we’d expect Wyoming and Vermont to have about 0.4 incidents over the whole period, Delaware 0.5, South Dakota 0.6 and West Virginia 0.8. If reports followed office counts, each of those five states would have somewhere between a 43% and a 66% chance of a zero. The zeros that are harder to put down to chance are Kansas, where we’d expect about 1.8, and Kentucky, about 2.5. Even there, the same model gives a zero about 1 time in 6 for Kansas and about 1 time in 13 for Kentucky.
The third is that some breaches never reach the list in a form anyone can trace to dental. In our study of dental vendor data breaches missing from the HHS list, a dental software vendor’s breach of about 15 million people had no portal entry we could find, and ransomware at two dental IT providers in 2019 left none we could find either. A zero means we found no dental-only provider report filed under that state, and that’s all it means.
States with the highest and lowest dental breach reporting rates
Oregon has 10 dental provider incidents on the list, 5.2 per 1,000 dental offices, the highest rate of any state and about 3 times the national rate. At the national rate we’d expect about 3.4. All ten reports come from individual practices, and they’re spread from 2012 to 2024, with no two on the same date.
Minnesota has the second-highest rate: 9 incidents, 4.8 per 1,000 offices, about 2.7 times the national rate, against about 3.3 expected. Its two biggest reports are both from larger organizations. Park Dental Partners, which runs administration for both Park Dental and The Dental Specialists, says in its annual SEC filing that it became aware of unauthorized activity in a limited number of employee email accounts on January 23, 2024. Both practices filed HHS reports on the same day that August, and we count them as one incident. The other is a 2025 report from Community Dental Care, a nonprofit dental provider.
At the other end, California has 25 incidents where its 22,757 dental offices would predict about 40, the largest shortfall of any state. Illinois has 4 against about 10, the next largest. Several others, including Georgia, New Jersey and Massachusetts, have lower rates than California, on much smaller numbers.
The data doesn’t say why. A state can report more because it has more practices large enough to cross the 500-person line, because more of its dental organizations file in-state rather than from a headquarters elsewhere, because local practices are more careful about reporting, or because more breaches happen there. Our matching can also miss dental practices whose legal names have no dental word, and that kind of miss could fall unevenly by state. Public records can’t separate these.
Even Oregon’s difference, the strongest of any state, doesn’t hold up once you adjust for having looked at 51 jurisdictions, and neither does any other. These are reporting rates, and they can’t show that any state differs in breach risk.
Dental breach reports in the ten states Medix serves
Medix is based in Iowa, and our core market is ten states: Colorado, Iowa, Illinois, Kansas, Minnesota, Missouri, Nebraska, South Dakota, Wisconsin and Wyoming. Kansas, Nebraska, South Dakota and Wyoming are among the nine with no dental provider report on the list. If you run a group in one of these states, the useful question is which of your legal entities would show up on a search, and under which state.
| State | Incidents | Expected | Per 1,000 offices |
|---|---|---|---|
| Colorado | 5 | 5.2 | 1.7 |
| Illinois | 4 | 10.2 | 0.7 |
| Iowa | 1 | 1.8 | 1.0 |
| Kansas | 0 | 1.8 | 0.0 |
| Minnesota | 9 | 3.3 | 4.8 |
| Missouri | 5 | 3.3 | 2.6 |
| Nebraska | 0 | 1.3 | 0.0 |
| South Dakota | 0 | 0.6 | 0.0 |
| Wisconsin | 5 | 3.4 | 2.6 |
| Wyoming | 0 | 0.4 | 0.0 |
I’d read that table the same way for every state on it. A low count is not a clean bill of health, and a high count isn’t proof that practices there are less secure.
What this means for a dental group
I’ve sat on the buy side of $1B+ in dental practice M&A diligence. A search of the federal breach list is one of the quickest checks a buyer or a group can run. It’s a reasonable first search and a poor last one. Here’s how I’d use it.
- Search by every legal entity name as well as the brand. Dental groups often file from headquarters, so a group’s breach can sit under a different state than the practices it affected. All 12 reports from a 2021 incident at one large group’s management company are filed under Pennsylvania, including the ones for practice entities named for Florida, Georgia, Texas and New York.
- Treat a clean search as one data point. Breaches that affect fewer than 500 people never reach the public list at all.
- Ask for the log. Under 45 CFR 164.408, a practice that had breaches affecting fewer than 500 people has to keep a log or other documentation of them and notify HHS within 60 days after each calendar year ends. In an acquisition, ask for that documentation going back several years, along with the write-up for any incident the practice decided wasn’t reportable. Our guide to what the HIPAA breach notification rule actually requires walks through those obligations.
- Keep one shared incident record for the whole group, linking every affected entity, its filing dates and its HHS reports, so you can give a buyer a complete account.
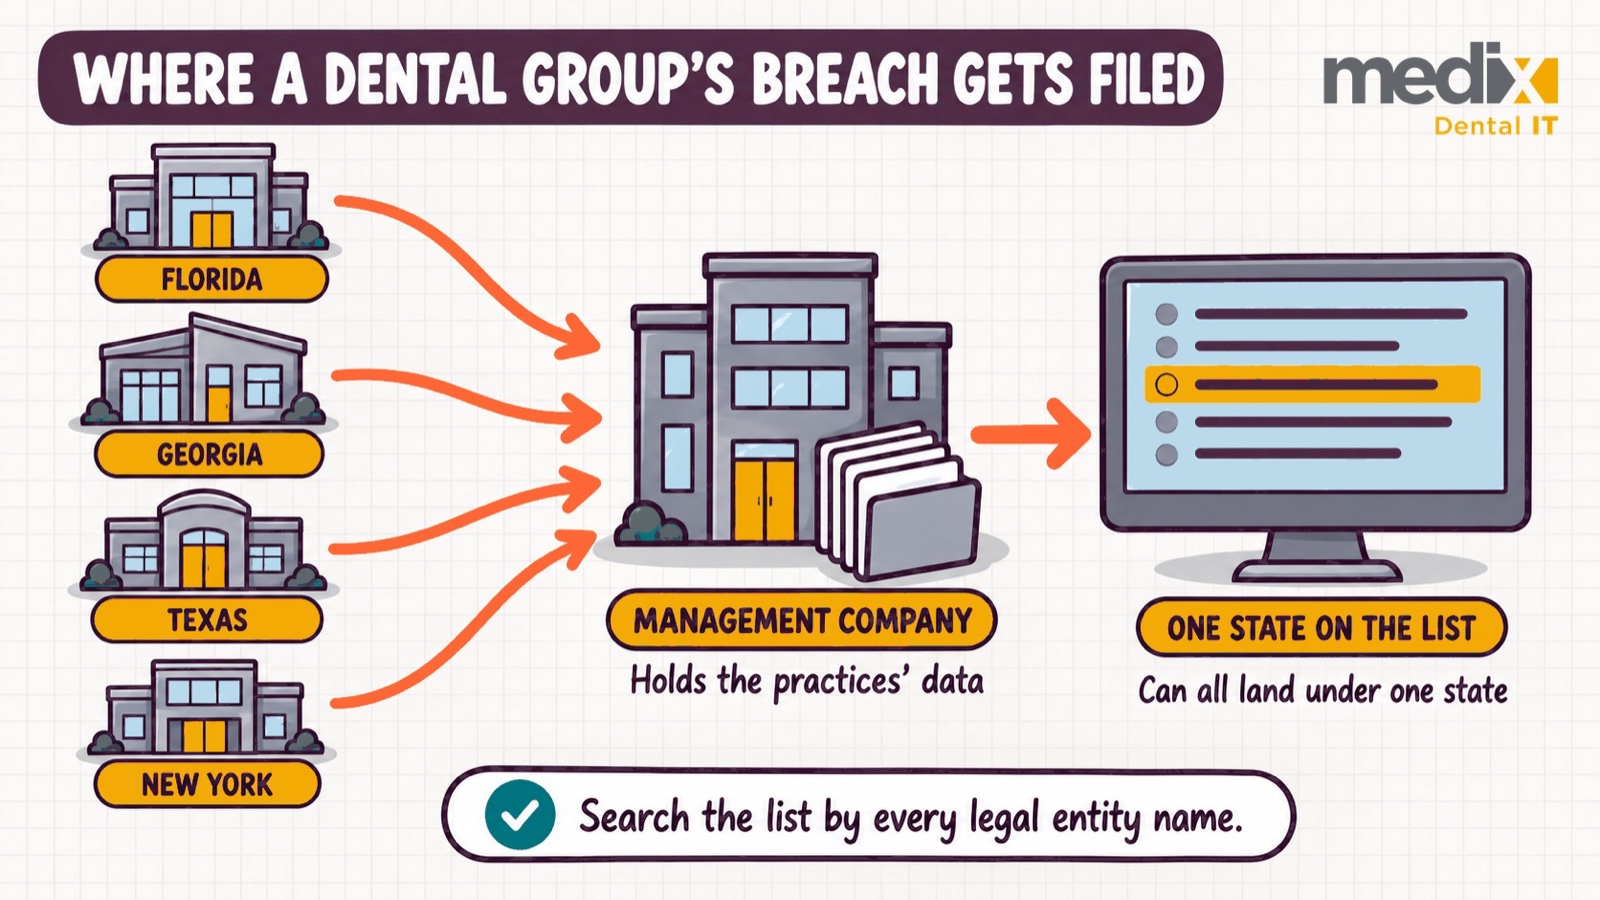
We cover the rest of that review in our dental practice acquisition IT due diligence checklist. A clean state record on a federal list can’t tell you what a target’s breach history looks like, so ask for the evidence yourself.
Dental data breaches by state: every state’s count
Here is every state and the District of Columbia. Small states can move a long way on a single report, so read the expected column next to the count before drawing any conclusion.
| State | Offices | Incidents | Expected | Per 1,000 |
|---|---|---|---|---|
| Alabama | 1,402 | 6 | 2.5 | 4.3 |
| Alaska | 315 | 1 | 0.6 | 3.2 |
| Arizona | 2,922 | 5 | 5.1 | 1.7 |
| Arkansas | 917 | 2 | 1.6 | 2.2 |
| California | 22,757 | 25 | 40.1 | 1.1 |
| Colorado | 2,957 | 5 | 5.2 | 1.7 |
| Connecticut | 1,625 | 5 | 2.9 | 3.1 |
| Delaware | 294 | 0 | 0.5 | 0.0 |
| District of Columbia | 310 | 1 | 0.5 | 3.2 |
| Florida | 9,039 | 19 | 15.9 | 2.1 |
| Georgia | 3,663 | 3 | 6.5 | 0.8 |
| Hawaii | 577 | 2 | 1.0 | 3.5 |
| Idaho | 943 | 2 | 1.7 | 2.1 |
| Illinois | 5,781 | 4 | 10.2 | 0.7 |
| Indiana | 2,246 | 8 | 4.0 | 3.6 |
| Iowa | 1,030 | 1 | 1.8 | 1.0 |
| Kansas | 1,021 | 0 | 1.8 | 0.0 |
| Kentucky | 1,440 | 0 | 2.5 | 0.0 |
| Louisiana | 1,575 | 3 | 2.8 | 1.9 |
| Maine | 457 | 2 | 0.8 | 4.4 |
| Maryland | 2,561 | 3 | 4.5 | 1.2 |
| Massachusetts | 3,188 | 3 | 5.6 | 0.9 |
| Michigan | 3,795 | 4 | 6.7 | 1.1 |
| Minnesota | 1,884 | 9 | 3.3 | 4.8 |
| Mississippi | 915 | 1 | 1.6 | 1.1 |
| Missouri | 1,899 | 5 | 3.3 | 2.6 |
| Montana | 529 | 1 | 0.9 | 1.9 |
| Nebraska | 744 | 0 | 1.3 | 0.0 |
| Nevada | 1,320 | 5 | 2.3 | 3.8 |
| New Hampshire | 586 | 0 | 1.0 | 0.0 |
| New Jersey | 4,511 | 4 | 7.9 | 0.9 |
| New Mexico | 684 | 1 | 1.2 | 1.5 |
| New York | 8,001 | 10 | 14.1 | 1.2 |
| North Carolina | 3,551 | 11 | 6.3 | 3.1 |
| North Dakota | 282 | 1 | 0.5 | 3.5 |
| Ohio | 3,814 | 8 | 6.7 | 2.1 |
| Oklahoma | 1,373 | 2 | 2.4 | 1.5 |
| Oregon | 1,913 | 10 | 3.4 | 5.2 |
| Pennsylvania | 4,649 | 11 | 8.2 | 2.4 |
| Rhode Island | 327 | 1 | 0.6 | 3.1 |
| South Carolina | 1,758 | 3 | 3.1 | 1.7 |
| South Dakota | 317 | 0 | 0.6 | 0.0 |
| Tennessee | 2,225 | 6 | 3.9 | 2.7 |
| Texas | 11,902 | 20 | 21.0 | 1.7 |
| Utah | 1,789 | 2 | 3.2 | 1.1 |
| Vermont | 235 | 0 | 0.4 | 0.0 |
| Virginia | 3,402 | 7 | 6.0 | 2.1 |
| Washington | 3,633 | 12 | 6.4 | 3.3 |
| West Virginia | 473 | 0 | 0.8 | 0.0 |
| Wisconsin | 1,902 | 5 | 3.4 | 2.6 |
| Wyoming | 232 | 0 | 0.4 | 0.0 |
| United States | 135,665 | 239 | 239 | 1.76 |
How we counted
This study uses the same October 13, 2026 download of the HHS Office for Civil Rights breach portal as our vendor study, which looked at reports from 2019 on and included dental plans and vendors. Here we kept the whole list, every report submitted through September 30, 2026, and counted dental providers only. The first dental report on the list is from January 2010. An incident here means one breach event at a dental provider, however many HHS reports it produced.
We found dental reports by dental terms in the organization’s name or OCR’s description, plus a list of known dental groups, plans and vendors, then removed false matches by hand. For this study we counted dental providers only: practices, dental groups and dental schools. We left out dental plans and dental vendors, because they file from headquarters and serve patients in many states. We also left out community health centers that offer both medical and dental care. Reports from one event were counted as one incident, which gives 239 incidents from 260 reports. Our earlier counts of the biggest dental data breaches and of dental ransomware listings with no public breach filing we could find draw on the same portal.
Each incident is counted in the state on its HHS report, which for a group can be its headquarters. A group incident can involve many offices and still counts as one incident in its filing state. Leaving out plans and vendors doesn’t remove that effect, because dental groups file this way too. That’s also why this study shows no state-by-state count of people affected: a single group filing from its headquarters would make one state look like it had millions of local patients affected. Two locations of one California practice filed separate reports two days apart. The California attorney general’s list shows different breach dates for them, May 7 and May 28, 2025, and with no notice tying them together we counted two incidents.
For the number of dental offices we used the Census Bureau’s County Business Patterns for 2023, offices of dentists (NAICS 621210): 135,665 offices with paid employees across the 50 states and the District of Columbia. One year’s office count is used against 17 years of reports, so the rate is useful only for comparing states with each other, and it says nothing about the odds of any one practice being breached. The expected count for each state is its share of the nation’s dental offices times the national total of incidents.
To test whether the spread between states is more than chance, we compared every state’s count with its expected count (chi-square 82.1 on 50 degrees of freedom) and simulated 100,000 random spreads of the same incidents across states in proportion to their offices. About 1 in 100 came out as uneven as the real data. We then tested each state on its own against its expected count (an exact Poisson test) and adjusted for testing 51 jurisdictions with both the Bonferroni and Benjamini-Hochberg methods. No state’s difference met the usual 0.05 threshold after either adjustment.
The limits, in plain terms. The public list only includes breaches of 500 or more people. Our name matching misses dental organizations with no dental word in their legal name. We checked the nine zero states report by report, but we didn’t run that full check in the other 42 jurisdictions, so some of their counts may be low. A state’s count measures reporting to HHS, and how secure the dental practices there are is a separate question this data can’t answer.
Posted in Dental Cybersecurity, DSO